DeFi Yield Grading Audit: 5,299 Pools Reviewed on August 17, 2026
DeFi yield data is easy to collect. The difficult part is deciding what the numbers mean.
A 20% APY can look better than a 3% APY while carrying dramatically different risks. TVL can signal scale, but it does not by itself prove safety. A score can be useful, but only if the method behind it is explicit and repeatable.
This report documents the August 17, 2026 Litmus yield snapshot and the audit framework used to examine it. The snapshot contains 5,299 pools with pool identifiers, protocols, chains, assets, APY, TVL, scores, and A–F grades.
The goal is not to claim that a grade is an objective truth. The goal is to make the assessment consistent, inspectable, timestamped, and increasingly auditable over time.
The snapshot at a glance
| Metric | August 17, 2026 snapshot |
|---|---|
| Pools recorded | 5,299 |
| Core fields | Pool ID, protocol, chain, asset, APY, TVL, score, grade |
| Score range | 0–100 |
| Grade scale | A–F |
| Snapshot date | August 17, 2026 |
| Historical identity | Stable poolId for temporal comparison |
The snapshot is deliberately more than a ranked list. Each record carries a stable pool identifier so that the same opportunity can be followed across future snapshots.
What the data shows
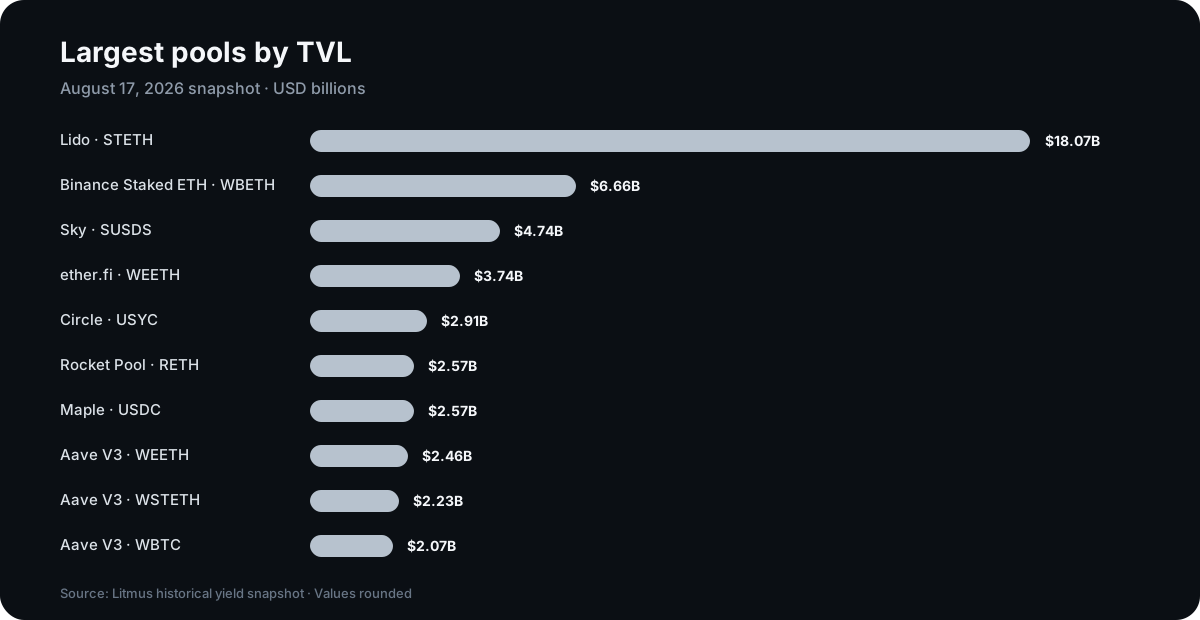
The largest pools in the snapshot are dominated by established staking, lending, and tokenized-asset markets. Lido's STETH pool is recorded with roughly $18.07 billion TVL, followed by Binance Staked ETH's WBETH at about $6.66 billion, Sky's sUSDS at about $4.74 billion, and ether.fi's weETH at about $3.74 billion.
Importantly, high TVL does not automatically produce a high grade. The methodology treats scale as context rather than as a substitute for risk analysis.
Several records also illustrate why APY should not be used as a standalone ranking signal. For example, a Base WETH-USDC Uniswap v3 pool in the snapshot shows 18.95% APY but a D score of 58, while several lower-APY pools receive A grades. That is the intended behavior of a risk-aware scoring framework: higher yield should not automatically mean a better opportunity.
How the Litmus grading system works
The system first produces a numerical score from 0 to 100. That score is then mapped to a letter grade using fixed bands:
| Score | Grade | Interpretation |
|---|---|---|
| 85–100 | A | Strongest relative profile under the published methodology |
| 72–84 | B | Good profile, with meaningful considerations |
| 60–71 | C | Moderate profile; additional scrutiny warranted |
| 45–59 | D | Higher-risk profile |
| 0–44 | F | Weakest profile under the methodology |
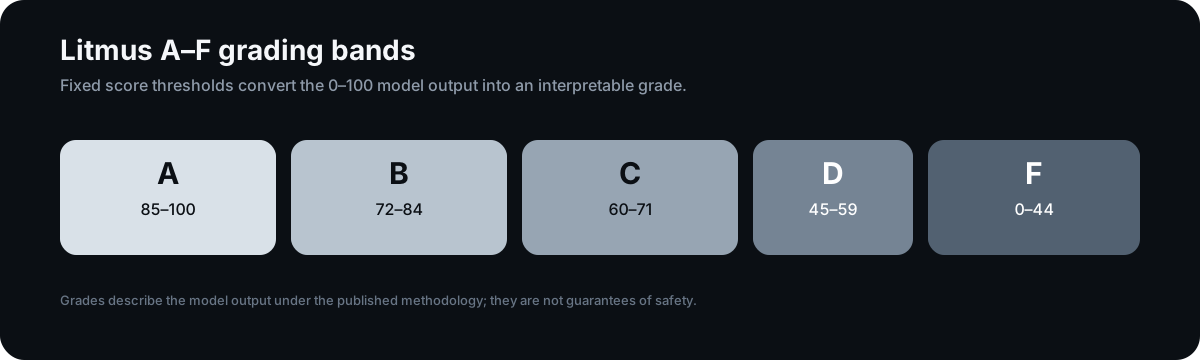
The grade is therefore not an APY ranking. It is a compressed representation of the underlying score.
Why this distinction matters
A yield dashboard can answer:
What pays the most?
A research system should also help answer:
What does the yield look like when considered alongside the other signals available to the model?
That distinction is central to the Litmus approach.
The audit has two different questions
One of the most important changes in this audit was separating snapshot integrity from scoring-model validation.
These are related, but they are not the same thing.
Phase A: Snapshot integrity
This phase uses only the data stored in the historical snapshot. It checks whether the dataset is internally coherent.
The checks include:
- Declared pool count versus the actual
pools.length. - Pool ID uniqueness.
- Required fields such as protocol, chain, symbol, grade, score, APY, and TVL.
- Numeric types and score range.
- Grade-to-score consistency against the canonical A–F bands.
- Duplicate economic identifiers using protocol, symbol, and chain.
- Basic APY and TVL anomaly detection.
- High-TVL/low-score combinations that deserve investigation.
This is an authoritative integrity check of the snapshot itself.
It does not require the original external inputs used to calculate the score.
Phase B: Temporal analysis
Once multiple snapshots exist, the same poolId can be compared across dates.
For recurring pools, Litmus can track changes in:
- APY
- TVL
- Score
- Grade
Large changes can then be surfaced rather than hidden inside a constantly changing dashboard.
This turns the dataset from a collection of point-in-time rankings into a developing historical record.
What the audit does not claim
This distinction is important enough to state plainly.
The historical snapshot stores the result of the scoring process, but it does not necessarily store every raw input that was available to the scoring model at that exact moment.
For example, the snapshot can contain apy, while the original model may also have used fields such as base APY, reward APY, one-day APY change, or a 30-day mean.
Without those historical inputs, recomputing a score later from today's live data would not be a true reproduction of the historical calculation.
That is why Litmus does not treat a live-data recomputation as authoritative historical validation.
Instead, the research framework makes a clean distinction:
Snapshot integrity: Can we verify that the historical record is internally consistent?
Model validation: Can we reproduce the historical score from the same raw inputs used at the time?
The second question requires preserved historical inputs.
Why this makes the research more credible
It is tempting for an analytics product to call every successful data check an audit. That would be misleading here.
A stronger approach is to state exactly what has been verified and what still requires evidence.
For the August 17 snapshot, the integrity audit can validate the structure and internal consistency of the stored records. Historical model reproduction remains a separate research track that becomes stronger as the underlying raw yield inputs are preserved alongside each snapshot.
That creates a useful progression:
Observed data → stored snapshot → integrity checks → historical comparison → model reproduction.
Each layer adds evidence without pretending that one layer proves another.
Examples from the August 17 snapshot
The top of the snapshot includes several large, relatively low-APY opportunities:
- Lido STETH: 2.14% APY, $18.07B TVL, A / 92.
- Binance Staked ETH WBETH: 2.30% APY, $6.66B TVL, A / 92.
- Sky sUSDS: 3.52% APY, $4.74B TVL, A / 92.
- ether.fi weETH: 2.38% APY, $3.74B TVL, A / 96.
- Maple USDC: 4.82% APY, $2.57B TVL, A / 95.
At the same time, the dataset contains much higher-yield pools that do not receive an A grade. The Uniswap v3 WETH-USDC example above is particularly useful because it demonstrates the core principle: yield and grade are deliberately not interchangeable.
These examples should be interpreted as outputs of the methodology, not as investment recommendations.
Where the grading model can improve
The framework is useful today, but it should not be treated as finished.
The next stage of research should focus on calibration rather than cosmetic changes to the letter grades.
1. Preserve the raw scoring inputs
Historical model validation becomes much stronger when every snapshot preserves the exact inputs used to calculate the score.
2. Test score stability
A small movement in one input should not cause an unexpectedly large score jump unless the model intentionally contains a threshold effect.
3. Test edge cases
The model should be challenged with:
- Extremely high APY.
- Near-zero APY.
- Rapid TVL growth or decline.
- Very large pools with weak yield signals.
- New pools with limited history.
- Reward-heavy yields.
- Pools whose underlying asset or protocol risk changes rapidly.
4. Measure historical usefulness
As more snapshots accumulate, the most interesting question becomes whether the score provides useful information about subsequent changes in pool conditions.
That is where a historical grading record can become substantially more valuable than a static yield ranking.
The long-term research dataset
The real value of this system is not one day's ranking.
It is the accumulation of dated observations.
A future researcher should be able to ask questions such as:
- Which pools consistently maintained high grades?
- Which pools experienced sudden TVL outflows?
- Which high-APY opportunities saw their grades deteriorate?
- How often did a pool move from A to B, C, or below?
- Which protocols showed persistent changes across chains?
- Did a score change before or after major APY or TVL movements?
Those questions require historical data. They cannot be answered reliably from a live dashboard alone.
Methodology status
Current status: Publishable, transparent, and under continuous calibration.
The A–F framework is deterministic once its scoring inputs are fixed. The snapshot format is structured for integrity checks and historical comparison. The principal remaining research gap is full historical reproduction of every score from the exact raw inputs available at scoring time.
That is a limitation worth documenting, not hiding.
Conclusion
The August 17, 2026 snapshot contains 5,299 DeFi yield pools and provides a useful foundation for systematic yield research.
The strongest part of the framework is not the letter grade itself. It is the combination of transparent scoring, timestamped observations, stable pool identifiers, integrity checks, and historical comparison.
The grading model will continue to be refined as more historical data becomes available. The methodology is designed to evolve without losing the audit trail of what was previously recorded.
For clients, researchers, and protocol teams, that creates a more useful product than a simple list of the highest APYs: a documented research layer for understanding how DeFi yield opportunities change over time.
Research note: Litmus Safety Grades represent an opinion generated under a published methodology. They are informational, not investment advice, and do not guarantee protocol, asset, or smart-contract safety.
Snapshot: August 17, 2026 · Coverage: 5,299 pools · Framework: A–F / 0–100 · Research status: Historical integrity validated; model reproduction is a separate validation track.