A market that expanded, peaked, and then settled higher
Litmus tracked the Dolomite USD1 market on Ethereum across 13 weekly snapshots from June 11 through August 24, 2026.
The series shows a clear capital cycle. TVL first contracted, then expanded rapidly to a $142.8M peak before retracing to $102.9M. Over the full period, the market still ended at more than four times its starting TVL.
At the same time, APY moved lower as capital increased, while the Litmus score recovered from a temporary dip and held at B for the final seven snapshots.
The numbers
- Starting TVL: $23.8M
- Ending TVL: $102.9M
- Peak TVL: $142.8M on July 6
- TVL change: +331.9%
- Starting APY: 12.05%
- Ending APY: 8.56%
- Litmus score: 74/B → 78/B
- Snapshot coverage: 13/13, with no gaps
The capital cycle
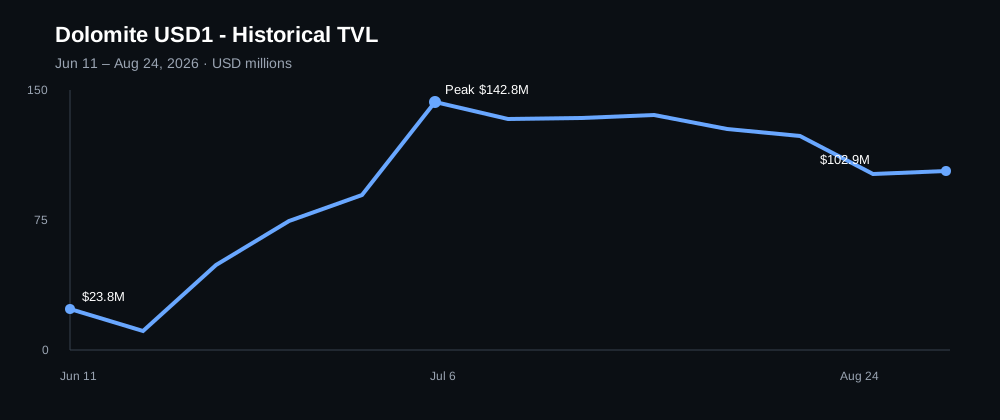
The period did not begin with steady growth.
TVL fell from $23.8M to $10.8M between June 11 and June 15, a 54.8% decline in the first week. The market then reversed sharply. TVL rose 353.4% between June 15 and June 18 before continuing higher through early July.
The largest absolute weekly move came between June 29 and July 6, when TVL increased by $53.6M (+60.0%) and reached the series peak of $142.8M.
After the peak, capital remained relatively stable for several weeks, mostly between $123M and $135M. It then declined again, including an $22.3M (-18.1%) weekly drop between August 10 and August 17.
The final snapshot recorded $102.9M - 27.9% below the historical peak, but still 4.32× the starting level.
So the historical pattern is better described as initial contraction → rapid capital expansion → peak → partial retracement, rather than simple steady growth.
Yield normalized as capital increased
APY followed a different direction during the main capital expansion.
It opened at 12.05%, reached a series high of 16.97% on June 15, and then declined across the following snapshots to a series low of 7.01% on July 6 - the same date TVL reached its historical peak.
By August 24, APY was 8.56%.
The data therefore shows a strong inverse movement during the main expansion window: TVL increased sharply while APY moved down from its high toward its low. That is consistent with yield normalizing as capital increased. The data alone, however, does not establish the cause of the capital inflow.
The Litmus score stayed resilient
The Litmus score began at 74 (Grade B), fell to 62 (Grade C) on June 15, and then recovered.
It first reached its series high of 78 (Grade B) on June 29. From July 13 through the final August 24 snapshot, the score remained at 78 for seven consecutive snapshots.
The score therefore ended four points above where it started, while the letter grade was B at both the beginning and end of the observed period.
This matters because the capital expansion was not accompanied by a deterioration in the final Litmus assessment. The score recovered early and then remained stable even as TVL later retraced from its peak.
What stands out
1. The market ended substantially larger than it began.
TVL increased from $23.8M to $102.9M, a 331.9% net increase despite the post-peak retracement.
2. The biggest capital expansion coincided with lower APY.
TVL reached its peak while APY reached its historical low of 7.01%. The two series moved in opposite directions during the main expansion window.
3. The final score was stable.
The Litmus score ended at 78/B and had remained at that level for seven consecutive snapshots.
4. The historical path was volatile at the beginning.
The market first lost more than half its TVL before experiencing its largest percentage increase of the period. Looking only at the start and end points would hide that early volatility.
Methodology
This analysis uses 13 weekly historical snapshots collected between June 11 and August 24, 2026. The pool was identified using its unique pool ID:
86e18974-35ca-4948-9c82-694facf9d082
The identifier was matched independently across all 13 snapshot files. TVL and APY figures are the values recorded in the historical dataset. Litmus scores are the point-in-time scores recorded for each snapshot.
The analysis is observational. Conditions between snapshots are not observed, and no causal explanation is asserted for movements in TVL, APY, or score.
Read the full report
The complete six-page Litmus Historical Intelligence Report contains the full historical timeline, detailed metrics, methodology, data-quality checks, and limitations.
Download the full Dolomite USD1 Historical Intelligence Report (PDF)
Disclaimer
This report is historical, observational analysis of publicly observable pool data. It is not investment advice and does not predict future performance. Always verify current conditions with the underlying protocol before depositing.